The efficiency of market-determined risk classification in automobile insurance is a lasting matter of controversy. It can be traced back to the 1950s [3] and received broad economic attention in the 1980s when spiralling car insurance premiums in the US were blamed on tariff regulations prohibiting the use of sex, age and location as risk characteristics [4]. In a mirroring move the EU saw a heated political and legal debate on the use of special tariffs for foreigners, in the 1980s, which resulted in a legal ban of ‘discriminatory’ tariffs for mandatory insurance schemes in many European countries [5]. The latest blow against risk classification in car insurance comes with the EU directive on gender equality [6] which proposes to prohibit gender specific calculation of all private insurance products, including non-mandatory branches such as life, private health or comprehensive car insurance.
There is a great body of economic literature, often from fields unrelated to insurance, that looks into the efficiency of market-determined risk classification. The general result of this literature is that efficient low cost information on risk will be selected by the market, but there can be excessive classification with costly information [7]. Arbitrary or superfluous information will generally not be selected by the market [8]. These results are derived for an unregulated market in which consumers are free to buy their preferred amount of coverage. There is only limited literature that deals with risk classification in mandatory insurance markets, this literature arrives at somewhat more sceptical results. Hoy shows that risk discrimination becomes purely re-distributive under a mandated offer of the ‘same policy for everyone’ [9]. Polborn proves that risk classification in such settings may distort consumption behaviour [10], and Buzzachi/Valetti demonstrate that it could be used by oligopolistic firms for the purpose of strategic pricing [11].
This paper studies the empirical effects of risk classification in the mandatory third-party motor insurance (TPMI) of Germany. We find evidence that inefficient risk categories had been selected in this market while potentially efficient information may have been dismissed. Risk classification did generally not improve the efficiency of contracting or the composition of insureds in this market. These findings can be partly explained by the existence of compulsory fixed coverage and other institutional restraints such as unitary owner insurance in this market.
The paper breaks into seven sections. In section two, we review the efficiency effects of risk classification and demonstrate it’s complementarity with a bonus-malus system of (partial) experience rating. In section three, we give a brief historic overview on risk classification in German TPMI and discuss the patterns of diffusion of the ‘new’ risk characteristics, which followed the EU directive on non-life insurance of 1994. In section four, we study the empirical effects of applying these new risk determinants on firm performance. Our study is based on observations of changes in firm-specific loss ratios in the period 1995-1997. In section five, we complement our findings by looking at aggregate effects in the TPMI market. Specifically, we discuss longer-term price trends and trends in traffic-related damages as ancillary evidence for the missing efficacy of the newly introduced tariff items. In section six, we provide new evidence that prior traffic violations (demerit points) are a powerful predictor of future accidents and discuss why this risk determinant has not been applied in Germany. Section seven summarises our results and discusses the implications of our findings for the current political debate in the EU.
While the public policy debate on risk classification mainly focuses on the equity dimension [12], economists are more concerned with its effects on efficiency. Their basic argument, in favour of risk categorisation, is that the problem of adverse selection may arise if firms are unable to distinguish between different types of risks but clients can, ie if asymmetric information persists. Adverse selection implies that high-risk types are able to purchase coverage at a premium below their expected damage. As a result firms earn a loss on each such contract. Adverse selection also implies that pooled contracts with low and high risks will be driven out of the market as a result of lacking demand of low-risks and competitive pressures from other firms. The lacking demand problem is described in a seminal paper of Akerlof [13]. Low-risk insureds increasingly strive for self-insurance as the price of insurance approaches the actuarial fair premium of high risks in a process of adverse selection. Another force for classifying risks is competition. Any insurer offering a contract that pools low and high risks will face a competing contract from other insurers aimed to attract the low risks from its pool. The reason is that such ‘cream skimming’ behaviour creates an information rent for the innovative firm. While temporary by nature (because the attacked firm will respond accordingly) these rents provide a constant motive to search for risk characteristics that help identify better than average risks in any incompletely separated market.
Rothschild and Stiglitz [14] have demonstrated that a set of separating contracts can equilibrate adverse selection markets, provided the share of high risks in the pool of insureds is above a critical level. This ‘separating equilibrium’ is characterised by differential coverage for high-risk consumers and low-risk clients. High risk consumers receive complete coverage while low risk consumers have less than full coverage. Both are priced at their respective actuarial fair premium. This solution, which has since been refined as an equilibrium concept [15], is characterised by a rationing of low-risk clients. The efficiency of risk classification immediately follows from this negative externality. Improved information on the part of the insurer allows to ease the rationing of low-risk insureds. With perfect discrimination all insureds receive desired complete coverage at actuarial fair premiums. This possibility of welfare enhancing information is noted in Rothschild and Stiglitz [16], (1976, 638). It has been studied in-depth for various types of costly imperfect information by Hoy, and Crocker and Snow [17].
This efficiency gain from risk classification only arises if the quantity of insurance coverage is a choice variable of customers. If insureds are mandated to buy a fixed amount of coverage – say: unlimited coverage – classifying risks will by definition not affect the selected rate of coverage. While pricing high risk consumers a higher price decreases the rate of cross-subsidisation inherent to any mandatory scheme of insurance, it does not change the behaviour of insureds or, more specifically, their decision to co-insure. The effect of risk classification will therefore be purely re-distributive. In other words: it may improve the equity but not the efficiency of mandatory insurance.
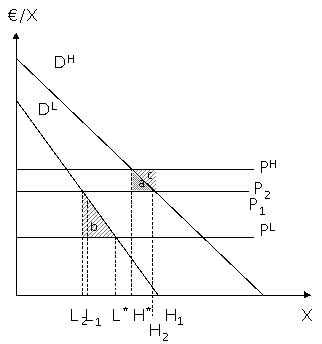
A second efficiency enhancing effect of risk classification follows from the improved composition of low- to high-risk insureds in the population of drivers. A simple graphical illustration of the effect is given in Figure 1 [18]. We consider the willingness to pay (€/X) and the number of policies (X) sold of two types of customers: low-risk drivers (L) and high-risk drivers (H). High-risk drivers exhibit a larger willingness-to-pay for insurance (DH) than low-risk-drivers (DL), because of greater risk exposure. In a perfectly separated market, low-risk drivers would pay a premium equal to their expected loss per period of PL and the number of insureds would amount to L*. Similarly, high-risk drivers would pay a premium of PH and their number would be H*. If risk classification is restricted so that both types of customers pay the same rate (P1), the number of low-risk drivers will decline to L1 while the number of drivers in the high-risk segment will increase to H1. Because of this changing proportion of high- to low-risk drivers the average cost of coverage increases to P2. Consequently, insurers have to increase the average premium to avoid loss. With P2 being the ultimate equilibrium price, the benefits of risk classification to low-risk drivers (b) exceeds the costs to high-risk-drivers (a) - mainly because the average price of insurance decreases from P2 to P1. The move from the pooled equilibrium (L2, H2) to the separated equilibrium (L*, H*) is welfare improving because the reduction in social cost of a decreasing number of high-risk drivers surmounts their willingness-to-pay by the shaded area c. The simultaneous increase of low-risk drivers in the pool is socially beneficial because their willingness to pay exceeds their expected accident costs by the shaded area b. The sum of b and c marks the social welfare enhancement from (costless) risk classification. It is due to an improved composition of insureds.
Figure 1: Efficiency of Risk Classification
The previous reasoning only considers the problem of adverse selection. But the problem of adverse selection may carry over to a problem of moral hazard. If insurance premiums are not reflecting expected damages the insureds level of activity, and their incentives for care, will also be distorted. High-risk types paying a too low premium will simply drive too much or act too careless while low-risk types will be overcautious or too reluctant to drive given a comparatively too high premium.
An institutionally important spill-over of this sort is the impact of risk classification on the incentives to take care under a ‘bonus-malus system’ (BMS). A BMS is a scheme of premium surcharges and rebates based on accident occurrence. BMS are widely used in OECD countries to control traffic related moral hazards [19]. Essentially, a BMS is a partial system of experience rating because it is based on the probability (occurrence) but not the severity of accidents (damage). The simplified example in Table 1 demonstrates how a system of unclassified (ie pooled fair) premiums (π) translates into inefficient incentives to take care given a BMS-type partial system of experience rating.
Table 1: Moral Hazard Effect of a Uniform Premium in a BMS Setting
|
H-Type |
L-Type |
|
Expected damage (EDH): 0.1 (1000)=100 |
Expected Damage (EDL): 0.05 (800) = 40 |
|
Pooled fair premium (πH = πL = π): 70 |
Pooled fair premium (π): 70 |
|
20% malus, unclassified: Δ π = 14 |
20% malus, unclassified: Δ π = 14 |
|
20% malus, risk classified: Δ EDH = 20 |
20% malus, risk classified: Δ EDL = 8 |
Let the expected damage of high-risk insureds be 100 resulting from a 10 per-cent chance of an accident with an average damage of 1000. The expected damage of low-risk types is set ceteris paribus at 40 resulting from an accident probability of 5 per-cent and an average damage of 800. The pooled fair premium is 70 accordingly. If a malus of 20 per-cent reflects the average increase in accident probability (partial BMS) conditional upon an observed occurrence within in this rating cell it would lead to a unitary surcharge of 14 for both risk types. This surcharge gives too little weight to the damage proneness of high-risk types. Consequently the incentives to take care are too low for high risk types (H-Types) and too high for low risks types (L-Types) under a pooled fair premium (π) as compared to risk-differentiated premiums (EDi, i=L, H). [20]
In summary, there are three separable efficiency effects from classifying risks according to their type. The first is improved efficiency in contracting. Risk classification enables low-risk consumers to buy desired full coverage in a Rothschild-Stiglitz-type adverse selection market. Importantly, this gain does not accrue in a mandatory fixed coverage scheme of insurance. The second gain is an improved composition of insureds in the pool. Risk classification increases the number of low risk drivers compared to the number of high risk drivers in the pool. This effect can also be seen in a fully regulated market. It appears in a decreasing average price of insurance. The third economic gain of risk classification is associated with moral hazard. Risk-classified tariffs incite efficient adjustments in drivers’ risk behaviour and provide an important weighting for a BMS-type partial scheme of experience rating. This effect results in decreasing traffic-related damages across all firms, including those firms with a non-improving or deteriorating composition of insureds.
The politics of risk classification in the German TPMI can be broadly divided into two periods. The ‘old’ system of risk characteristics started with the introduction of compulsory TPMI in 1942. The risk characteristics which were then stipulated, by the national regulatory board for insurance, were mainly commercial usage and motor power. This selection of risk determinants was based on the perception that traffic risks are influenced by the inherent dangerousness of the ‘machine’ or the activity. In 1962 an accident-based BMS was introduced. This was the first major move towards a driver-related system of risk classification which was „quasi-obligatory“ because the risk tables produced by the German insurance association (GDV) were binding all TPM insurers at that time. The 1960s also saw a shift towards locational and occupation-based tariffs. Paradoxically, it was the mutual insurance companies whose regional and professional ties triggered this move. Major institutional changes came with the EU’s third non-life insurance directive of 1994. It brought about a complete de-regulation of the insurance market; firms are since free to choose their risk rates. At the beginning of the deregulation period small firms had introduced new types of rebates and surcharges without any help of GDV; in the first place the voluntary, non-binding risk table of the GDV were only expanded to “mileage” and “garage” 1998 [21]. While the EU directive paved the way for firm-specific risk selection it did not change the basic mandatory nature of German TPMI, including the duty to contract for insurers. The immediate effect of the EU directive has been a ten-year period of experimenting with new risk characteristics, and another notable focus shift from non-driver to driver-related characteristics such as driver’s age and sex.
Table 2 depicts the diffusion of the new risk characteristics in Germany after deregulation in 1994. The entries in Table 2 relate different types of rebates and surcharges to the rate of market penetration (expressed as percentage of companies which applied these variables) at different years. ‘N’ indicates the number of observed insurance companies in each year. Hyphenated entries indicate that a tool was not used by any firm in a specific year. The risk characteristics are reported for the motor insurance market as a whole because separate data on risk variables for different classes of insurance (eg TPMI, comprehensive insurance) were not available. During the first three years (1995- 1997) nearly all German insurers reported to Finanztest. In subsequent years less information was available because of non-response by some firms.
Looking into the present system of rebates/ surcharges (2003), we find that Car Age, Driver Age, Mileage, Occupation and Garage Ownership are the most common risk variables. Other variables like Children and Long-term Client are used by nearly half the firms. Yet other variables such as Rebates for Safe Driving Practice and Fuel Saving Cars are supplied by only a few firms.
We may distinguish between four basic patterns of diffusion (see Figure 2).
Figure 2: Patterns of Diffusion
‘Successful’: The market penetration increases rapidly after introduction; it slows down in approaching complete diffusion (ie 100 per-cent market penetration). ‘Delayed’: The market penetration increases over a long period of time (say: a decade) at a low rate; it eventually approaches the 100 per-cent-level at some time. ‘Unsuccessful’: The market penetration increases rapidly at first; it reaches its maximum well below the 100 per-cent level (say: 30 per-cent) and decreases to zero thereafter. ‘Niche’: The market penetration remains low but constant over a long period of time (say: a decade). From Table 2, we take that Car Age, Mileage, Garage/ House-Ownership, Driver Age and Occupation exhibit a normal diffusion curve of firstly accelerated and consequently decelerated market penetration, which we call ‘successful’. Single Driver, Women, Children, Non-Owner Driver and Long-term client bonus show a ‘delayed’ pattern of diffusion, ie they are still in an acceleration stage. It cannot be said whether these risk characteristics achieve complete market penetration in the future (dotted line) or not. Fuel savers, Oldtimer, Rebates for Disabled and Surcharges for High Power Cars are ‘niche’ strategies pursued by few specialised insurers; the market penetration of these characteristics is constantly low. Rebates for Safe Driving Practice and Experienced Drivers (Age > 25), or surcharges for specific regions, had been tested but were withdrawn as ‘unsuccessful’. Table 2: Diffusion of New Risk Characteristics in Germany Risk characteristics 1995 (N=96) 1996 (N=106) 1997 (N=105) 1999 (N=88) 2000 (N=82) 2001 (N=80) 2002 (N=64) 2003 (N=50) Rebate [%] Car Age (New Cars or First Hand Owner) 3,11)
69,8 72,4 95,5 96,3 97,5 96,9 96 1,02)
0,9 12,6 Mileage (usually < 9.000 km/a) 3,1 34,9 64,8 85,2 86,6 90 90,6 96 Garage 3,1 34,0 65,7 89,8 86,6 95 93,8 96 Restricted Usage 1,03)
6,6 23,8 45,5 41,5 35 50 48 4,24)
4,7 35,2 Sex5)
4,2 22,6 21,9 23,9 12,2 16,2 20,3 42 Driver Age6) (25 – 65) - - - 26,1 52,4 67,5 - - Occupation7)
39,6 - - 47,7 73,2 83,8 81,3 86 Children8)
- 23,9 25,6 25 42,2 42 Long-term Client9)
- - - 33,0 36,6 31,3 35,9 44 Safe Driving Practice10)
- - - 11,4 17,1 12,5 9,4 8 Fuel Saving Car 1,0 1,9 3,8 - 1,2 2,5 3,1 2 Disabled 7,3 - - 2,3 - - - - Surcharge Car Age (Surcharge for Cars age 7 years and older) 9,4 49,1 56,2 95,5 96,3 97,5 96,9 96 Mileage (usually > 30.000 km/a) 2,1 7,5 31,4 85,2 86,6 90 90,6 96 Driver Age ( < mid 20) - - - - - - 71,9 94 Foreign Country Usage11)
- - - - 17,1 18,8 26,6 18 Non-Owner Driver - - - - - 12,5 28,1 48 Contract cancelled by previous insurer - - - - - 5 3,1 - High Power Cars - - - - 3,7 3,8 4,7 - Selected special characteristics Special Regionalisation12)
- - - - 7,3 12,5 18,8 6 Married - - - 4,5 - 1,3 1,6 4 Public Transport Subscribers - - - - 2,4 3,8 4,7 10 Comprehensive Coverage13)
- - - - 1,2 5 6,3 8 Oldtimer - - - - 24,4 20 32,8 - Notes: 1) New Car, 2) First Hand ower, 3) Single rebate, 4) Partner rebate, 5) Rebate for single femals drivers, 6) Rebate for drivers aged 25 or older. In 2002 such rebates were withdrawn in favour of surcharges for young drivers (above 25 years old), 7) Rebates for members of certain occupations such as policemen, civil servvants, clerics etc., 8) Owner with young children (below 12 years old), 9) Rebate for long term clients or bundled home insurance, 10) Rebate for successful participants in the federal traffic education programme, 11) Frequent driving outside Germany, 12) Premium adders for drivers in Berlin and selected post-code districts, or “New Laender” tariffs., 13) Rebate for combined comprehensive coverage or surcharge for missing combined comprehensive coverage . Sources: Finanztest 3/ 1995, Finanztest 5/ 1997, Finanztest 10/ 1999, Finanztest 11/ 2000, Finanztest 11/ 2001, Finanztest 11/ 2002, Finanztest 12/ 2003. Comparable data for 1998 are missing. In summary we find that German insurers have used their ‘new freedom of pricing’ intensively to experiment with new types of risk classifications. Few were successful while some seem to be still in the process of diffusion. Others have been used but were withdrawn after a few years. The rapid speed of the diffusion of successful risk characteristics in the first three years after deregulation (1995-1997) indicates a strong pressure to imitate innovative behaviour. A risk determinant of peculiar interest is Garage Ownership. Consumer associations have marked it ‘irrelevant’ and potentially ‘discriminatory’ [22]. Indeed, there is no obvious reason why garage owners would cause fewer traffic accidents than non-owners. There is no direct causal relationship between garage ownership and cautious driving. But perhaps there is a third, as yet unknown criterion, (eg, a caring attitude towards the car) which could explain a positive correlation. Similarly, the current trend of bundling insurance products could be either anti-competitive (eg, a cross-subsidisation for home insurance at the expense of the community of compulsorily insured car owners) or it could indicate a yet unknown indirect connection between house-ownership and safe driving.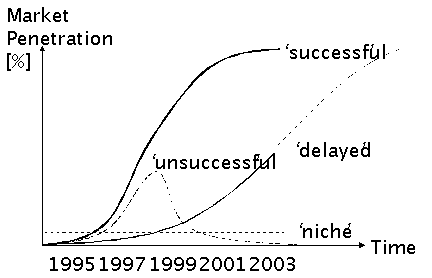
In order to test if risk classification creates information rents for innovative firms we studied the effect of applying the new risk characteristics on firm-specific loss ratios. The loss ratio in t (LRt) is defined as the sum of claims over the sum of premiums in period t:
(1) LRt = Sum of Claimst / Sum of Gross Premiumst * 100.
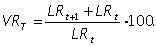
From economic view point we expext LRt >0 is given. The variation in the loss ratio (VRT) measures the percentage change of the loss ratio in two successive years:
(2)
The expected sign of variation rate depends on several conditions which will be presented in the following:
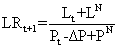
Introducing a rebate for ‘good risks’ as first mover will be accompanied by two offsetting economic effects. Its own ‘good risks’ will have to pay less premiums; consequently his premium revenues are decreasing compared to before (-ΔP). On the other hand, he will attract new ‘good risks’ so that additional premium revenues arise (+PN) jointly with additional damage payments for this group (+LN). Hence, one year later the loss ratio t+1 is:
(3)
 .
.
To decide about the expected sign of the variation rate VRT it is necessary to compare LRt and LRt+1. If LRt+1 is smaller than LRt,
(4)
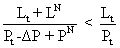 .
.
VRT will be negative, if:
(5)

A negative variation rate can be expected if either LN is small or PN - ∆P is high. A small LN may be the result of successfully attracting ‘good risks’, which is the center aim of this strategy. A large difference between PN and ∆P can be the result of two different effects. On the one hand, the additional premium income PN from new risks can be substantial. Alternatively, the premium revenue losses ∆P resulting from giving rebates to existing policy holders could be small. It is reasonable to expect that a rebate which is only offered by one firm or only a few firms (‘first movers’) can be small to attract ‘good risks’. It is also reasonable to expect that additional premium earnings (PN) for first movers will be high while premium revenue losses (∆P) will be low. Hence, a negative variation rate can be expected if rebates are given as part of a strategy of ‘innovative competition’.
Introducing a rebate in response to past innovative behaviour of other firms (‘imitative competition’) aims to prevent the loss of ‘good risks’ from an existing pool to competitors which are offering this rebate. The imitative strategy faces the problem that damages remain constant while revenues decrease. The loss ratio of the following year can be written as:
(6)
 .
.
Hence, the denominator decreases and LRt+1 increases. The variation rate VRT is positive with certainty. In other words: a strategy of imitative competition based on rebates leads to an increase of the loss ratio.
Innovators which are using surcharges create incentives for ‘bad risks’ to leave their pool. Consequently damages from this segment decrease (-LM) at these firms. Premium revenues from this subgroup too decreases (-PM). Hence, the loss ratio of t+1 can be calculated as:
(7)
 .
.
The variation rate VRT will be negative if LRt-1 is smaller than LRt; or:
(8)

Rearranging, we get:
(9)

Following this, we expect a negative variation rate for innovative surcharges, if the loss ratio of the leaving policy holders is higher than the average loss ratio in the pre-existing pool; in other words: if comparatively ‘bad risks’ leave the pool, which is the aim of this strategy. Assuming that surcharges are an appropriate way to achieve this effect, this inequality is given and we expect a negative variation rate as a result of innovative competition based on surcharges.
If an insurer introduces surcharges as a consequence of the behavior of other firms (‘imitative competition’) he aims to prevent ‘bad risks’ from entering his firm. Given that this defence strategy is successful, the new loss ratio is:
(10)
 .
.
Hence, the variation rate of loss ratio at best remains constant in the case of surcharge-based ‘imitative competition’.
A negative VRT can be seen as an information rent of insurance firms since the improved cost structure (decreasing sum of claims) is not fully passed through to the consumer (decreasing gross premiums). Based on our previous reasoning we assume that information rents accrue to innovators but not to imitators, since innovators face a better chance of attracting ‘good risks’ by targeted rebates. They also have a greater chance to shift ‘bad risks’ to other firms by targeted surcharges. Accordingly we classify a risk determinant as innovative (imitative) if less than 50 per-cent (more than 50 per-cent) of the market did apply it. Table 3 depicts the results of this classification for the study period 1995 to 1997.
Table 3: Innovative and Imitative Competition in Germany
|
1995 |
1996 |
1997 |
|
|
Age of car |
Innovative (N) |
Imitative (M) |
Imitative (M) |
|
Mileage |
Innovative (N) |
Innovative (N) |
Imitative (M) |
|
Restricted usage (female-, single-, partner rebate) |
Innovative (N) |
Innovative (N) |
Innovative (N) |
|
Special rebates or premium adders (rebates for fuel saving cars, special rating systems) |
Innovative (N) |
Innovative (N) |
Innovative (N) |
|
Garage rebate |
Innovative (N) |
Innovative (N) |
Imitative (M) |
We expect a negative VRT as a result of using Age of Car as a risk determinant only in 1995 because in subsequent years this risk characteristic was adopted by more than 50 per-cent of the firms. Similarly, we expect the Mileage per Year and the Garage Holding to improve the loss ratio in 1995 and 1996 before these risk factors became wide spread in 1997. Rebates for Female, Single, and Partner Drivers, which we grouped ‘Restricted Usage’, were innovative throughout the whole study period; so were a group of special rebates and premium adders such as rebates for Fuel Saving Cars and surcharges for Frequently Driving Outside Germany. Special attention is given to the Garage Rebate because many critics focus on this ‘counter-intuitive’ risk determinant [23].
We applied an ordinary least square (OLS) regression to control for other factors that affect the loss ratio such as field service, local operation, or restricted supply to special groups of insureds (eg members of professions):
VRT = ß0 + ß1Nt + ß2Nt-1 … ß3Mt + ß4Mt-1 + ß6Service + ß7 Local + ß8 Personal + ε
with:
ßi= regression co-efficients,
ε = error term,
Nt = innovative risk characteristic (applied < 50 per-cent of all firms),
Mt = imitative risk characteristic (applied > 50 per-cent of all firms),
Service = own field service (0,1),
Local = locally restricted supply (0,1),
Personal = group specific supply, eg only clerics (0,1).
Data on the firm-specific usage of new rebates and additional premiums were taken from the data set ‘Motor Vehicle Insurance Market’ [24]; firm-specific loss ratios are from Tillinghast Towers Perrin [25].
The descriptive values of VRT in this data set are depicted in Table 4.
Table 4: Variation Rate of Loss Ratios - Data Set: Motor Vehicle Insurance Market
|
|
91/92 |
92/93 |
93/94 |
94/95 |
95/96 |
96/97 |
97/98 |
98/99 |
|
|
Mean: |
% |
5.474 |
-3.049 |
-10.08 |
‑2.562 |
1.521 |
2.975 |
5.303 |
6.936 |
|
Median: |
3.737 |
‑1.314 |
‑8.829 |
‑2.099 |
0.860 |
4.174 |
5.755 |
1.963 |
|
|
Minimum: |
‑17.61 |
‑57.07 |
‑29.44 |
‑29.76 |
‑51.77 |
‑44.32 |
‑8758 |
‑30.56 |
|
|
Maximum: |
187.4 |
22.41 |
4.41 |
46.51 |
55.67 |
43.11 |
7367 |
538.3 |
|
|
Standard deviation: |
19.14 |
9.994 |
5.824 |
9.633 |
12.21 |
12.129 |
17.69 |
52.46 |
|
|
N: |
107 |
109 |
110 |
111 |
112 |
115 |
111 |
109 |
The results from the OLS regression are provided in Table 5 and Table 6.
Table 5: Firm-Level Effects (same year)1)
|
|
model 1 1995 |
model 2 1996 |
model 3 19973 |
|
Age of Car rebates or surcharge in 1995N / 1996M / 1997M (one or more=1) |
-8.828*** (-3.152) |
0.753 (0.320) |
-1.862 (-0.666) |
|
Mileage rebates or surcharge in 1995N / 1996N / 1997M (one or more=1) |
-2.708 (-0.585) |
-8.386** (-2.161) |
7.352* (1,899) |
|
Restricted usage rebates in 1995N / 1996N / 1997N (one or more=1) |
-2.385 (-0.618) |
4.287 (1.525) |
-2.524 (-0,928) |
|
Special rebates and additional premiums in 1995N / 1996N / 1997N (one or more=1) |
-1.795 (-0.682) |
0.627 (0.294) |
-5.970** (-2.364) |
|
Garage rebate in 1995N / 1996N / 1997M (Yes=1) |
0.938 (0.184) |
3.496 (0.999) |
-1.498 (-0.441) |
|
Service (Yes=1) |
0.446 (0.211) |
0.974 (0.440) |
3.553 (1,176) |
|
Local (Yes=1) |
-0.264 (-0.276) |
-1.089 (-1.038) |
-0.127 (-0.150) |
|
Personal (Yes=1) |
0.180 (0.057) |
5.065 (1.389) |
-5.051* (-1.954) |
|
Constant |
-1.754 (-0.936) |
0.708 (0.280) |
2.378 (0.884) |
|
R2 (adjusted) |
0.068 |
0.015 |
0.069 |
|
F-value (p-value) |
1.779* (0.094) |
1.174 (0.324) |
1.889* (0.072) |
|
N: |
87 |
95 |
97 |
|
Test of normality after Jarque/Bera2) |
H0 na (0.406) |
H0 a*** (0.004) |
H0 a*** (0.000) |
|
Test of homoscedasticity after White3) |
H0 na (0.991) |
H0 na (0.929) |
H0 a*** (0.000) |
Notes:
1) OLS-estimation; significant on 10 %-, 5 %-, and 1 %-level: *, ** and ***; t-values in parentheses,
2) H0 a: null hypothesis could be rejected, H0 na: null hypothesis could not be rejected; p-values in parentheses,
3) Heteroscedasticity-consistent-OLS-Estimation after White. Data set ‘motor vehicle insurance market’; estimated with EViews 4.0.
Model 1 analyses the effects of new tariff items used at the beginning of 1995 on the loss ratios of 1995, model 2 estimates the influence of risk determinants used in 1996 on the loss ratio in the same year, while model 3 looks at the same-year effects of tariff items used in 1997.
Table 5 shows that only a few new characteristics did significantly influence the profitability of firms such as Age of Car, Mileage and Special Rebates (bold marked in Table 5). These variables show the expected signs, ie a decline of the loss ratio after the risk factor was introduced. They also conform to our expectation by showing a positive sign if they were introduced as part of an imitative strategy. Interestingly, the Garage Rebate has no significant effect on the loss ratio in any year. The general picture that emerges from this analysis is that some risk determinants did provide information rents to innovators while other factors seem to be ill-taken (such as the Garage Rebate). Information rents were generally restricted to the first in the field.
Table 6: Firm-Level Effects (lagged)1)
|
|
model 4 1996 |
model 5 1997 |
model 6 1998 |
|
Age of Car rebates or surcharge in 1995N (one or more=1) |
-4,759*** (-1,540) |
6,068* (1,918) |
3,180 (0,857) |
|
Mileage rebates or surcharge in 1995N (one or more=1) |
-3,431 (-0,672) |
11,604** (2,108) |
-5,232 (-0,832) |
|
Restricted usage rebates in 1995N (one or more=1) |
5,016 (1,178) |
-5,161 (-1,172) |
3,347 (0,619) |
|
Special rebates and additional premiums in 1995N (one or more=1) |
6,675 (2,299) |
-3,262 (-1,154) |
3,092 (0,975) |
|
Garage rebate in 1995N (Yes=1) |
-4,775 (-0,849) |
2,582 (0,379) |
-8,760 (-1,149) |
|
Service (Yes=1) |
1,795 (0,770) |
-0,635 (-0,272) |
-2,975 (-1,127) |
|
Local (Yes=1) |
-1,697 (-1,612) |
1,555 (1,447) |
-0,617 (-0,513) |
|
Personal (Yes=1) |
5,999 (1,704) |
-3,728 (-1,042) |
1,094 (0,273) |
|
Constant |
-0,170 (-0,082) |
3,581* (1,736) |
7,661 (3,308) |
|
R2 (adjusted) |
0,053 |
0,043 |
-0,045 |
|
F-value (p-value) |
1,601 (0,138) |
1,499 (0,170) |
0,547 (0,817) |
|
N: |
87 |
90 |
86 |
|
Test of normality after Jarque/Bera2) |
H0 a*** (0,000) |
H0 a*** (0,000) |
H0 a** (0,017) |
|
Test of homoscedasticity after White3) |
H0 na (0,985) |
H0 na (0,914) |
H0 na (0,358) |
Notes:
1) OLS-estimation; significant on 10 %-, 5 %-, and 1 %-level: *, ** and ***; t-values in parentheses.
2) H0 a: null hypothesis could be rejected, H0 na: null hypothesis could not be rejected; p-values in parentheses.
3) Data set ‘motor vehicle insurance market’; estimated with EViews 4.0.
The lagged models in Table 6 demonstrate that these rents were principally temporary. Model 4 displays the effect of risk variables introduced in 1995 in the year 1996, model 5 the effects of risk variables in 1995 in the year 1997, and model 6 estimates the three-year lagged effects.
A typical pattern can be seen in the VRT effects on Age of Car (bold marked values). This risk determinant leads to a decrease in the loss ratios of 1995 (model 1, Table 5) and 1996 (model 4, Table 6) but this effect disappears soon after. A firm that introduced this risk determinant in 1995 as an innovator, indeed, suffered a significant increase in the loss ratio in 1997 (model 5) - only two years after. A similar pattern can be seen for the Mileage variable in 1997 (model 5). Obviously the informational rents to firms from applying these risk factors were exhausted after two years by a general diffusion of these characteristics; however, the market as a whole was not able to attract new low-risk types and/or increased coverage for low risks in a move to improve adverse selection.
The general picture that emerges is that the efficiency effects of new risk classifications in Germany in the mid 1990s were short-term and purely selective. Firms who introduced valid risk determinants as first movers were able to decrease their loss ratio (increase profitability) and make others (second movers) pay in form of higher loss ratios (decreasing profitability). This ‘fishing for good risks’ did however not lead to a lasting economic benefit for the inventors. After a maximum of two years the profitability enhancing effect reversed: loss ratios went up again.
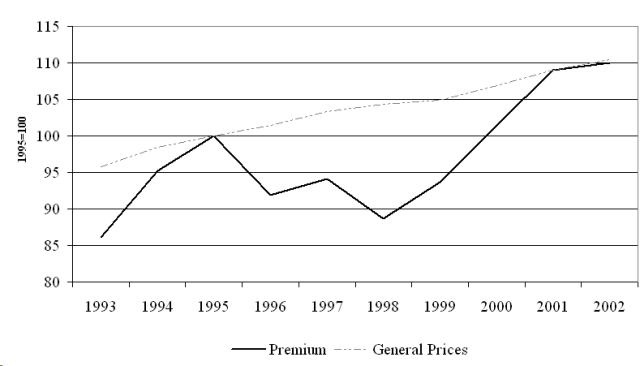
The key efficiency reason for risk classification is an expected decline in the average insurance premium due to an improved structure of total coverage (as explained in section two). Firm-specific variations of the loss ratio cannot fully capture this social benefit because they only measure the benefit to individual producers. We therefore look into the effect of new risk classifications on the market price for motor insurance coverage. Figure 3 compares the trend
of insurance premiums to the general trend in consumer prices following deregulation of tariffs. [26] The market price of TPMI coverage (solid line) exhibits a significant decline following the deregulation of tariffs in the period 1995 to 1997 but approaches the general price trend (dotted line) in a massive price hike since 1998. The social benefit of risk classification again shows to be temporary, similar to the effects on firm profitability. The joint evidence of firm and market effects is that the liberalisation of TPMI enabled short-term economic gains for innovative firms but did not increase the overall efficiency of contracting or improving the general structure of coverage. This can be partly explained by the binding system of mandatory coverage in Germany (see section two).
Figure 3: Premium Effects of Risk Classification
In section two we have demonstrated that a set of unclassified, pooled fair premiums (π) translates into inefficient incentives to take care under a BMS-type of experience rating. Risk classification may therefore improve the care taken by drivers. This effect also accrues in a compulsory coverage scheme of insurance. We therefore tested the validity of new risk characteristics by looking into the effects on traffic safety. Since care of different types of drivers cannot be directly observed, we used total damage (ie the number of accidents times the average damage per accident) as a proxy variable. The total damage indicates increased efficiency of care if we assume that the marginal costs to take care, are lower for high-risk types than for low-risk-types [27]. We expected overall more care and less total damage as a result of applying valid new risk characteristics.
Figure 4: Total Damage and Loss Ratio
Source: GDV statistics 2002 The trend of total damages depicted in Figure 4 disappoints this hope. In the five-year period following deregulation (1994-1999) we see an increase in total damages. The amount of total damage (adjusted for inflation) approaches the pre-liberalisation level only in the past few years. The increase of damages in this period contrasts a long-term trend of decreasing damages since the 1960s (not pictured). It coincides with a wave of new motorisation in East Germany after re-unification. To control this influence, we also looked into the aggregate average loss ratio, ie the sum of losses over the sum of premiums in the market. The aggregate average loss ratio, however, shows a very similar trend. It climbs in the period after de-regulation from 95 per-cent in 1993 to 110 per-cent in 1999 and approaches the pre-liberalisation level in 2001. In summary, there is no indication that risk classification did help contain moral hazard and increase traffic safety – very much in line with our earlier findings. This lacking response of drivers to risk classification cannot be attributed to the system of compulsory insurance. The reasons here could either be ill-taken risk determinants or a failure to correctly translate risk-based premiums into driver incentives. An ‘incentive failure’ of this sort arises, for instance, if premium payers and drivers fall into two – as is typically the case for a family of firm run cars in a unitary system of owner insurance. Such legally stipulated systems of insurance ownership, which we find in Germany and many European countries, may dilute the traffic safety effects of risk classification as we explain in the subsequent chapter.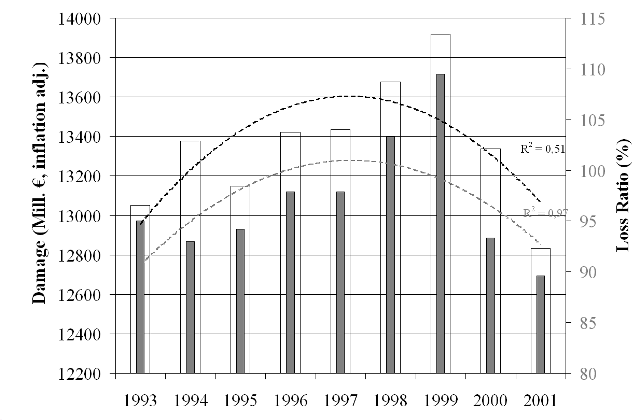
Given the disappointing showing of the new risk characteristics with regard to traffic safety, we looked into the efficacy of applying a so far not used ‘behavioural’ risk determinant: demerit points. Demerit points are weights for individual traffic violations recorded at the Federal Transport Authority (FTA) in Flensburg/ Germany. Demerit points systems (DPS) are widely used in Canada to calculate premium surcharges or premium rebates for periods of legal obedience. The OECD has since long encouraged member nations to apply similar schemes in insurance rating as an incentive for safe driving behaviour [28]. Indeed, there is ample evidence from Canada [29] and from Australia [30] that prior traffic violations successfully select good and bad drivers. Specifically they help to identify a group of notoriously bad drivers with a many times greater than average accident risk.
A recent study of the German FTA supports these findings. Schade and Heinzelmann estimate accident probabilities based on the observation of individual variables, including the number of prior traffic violations [31]. The estimation was done with aggregated cross-sectional and longitudinal data of the FTA. Based on the estimated accident probabilities the authors calculate the odds of different subgroups of drivers and compare these values with the odds of other subgroups. The resulting odds ratios are presented in Table 7. The group of ladies aged 41-60 is defined as reference risk (1*). The accident probability of this group is estimated at 36 accidents on 10,000 insureds. Being younger increases this risk almost three times (2,8: Female, aged 18-25), while being young and male increases the risk almost five times (4,8: Male, aged 18-25). Importantly, in all subgroups the risk increases significantly if prior traffic violations were observed. For individuals with more than one traffic violation (which can occur without suspension of the driver’s license if the violations are minor) the odds ratio may even increase up to 25 times the basic risk.
Table 7: Traffic Violations as Accident Predictor
|
Sex |
Other |
Persons with violations in t, t-1, ... |
||||
|
Age |
no violations |
1 violation |
2-3 violations |
>3 violations |
||
|
Male |
||||||
|
18 – 25 |
4,8 |
10,4 |
17,8 |
24,7 |
||
|
26 – 30 |
2,3 |
5,1 |
8,7 |
12,1 |
||
|
31 – 40 |
1,9 |
4,1 |
6,9 |
9,6 |
||
|
41 – 60 |
1,7 |
3,8 |
6,4 |
8,9 |
||
|
> 60 |
1,6 |
3,4 |
5,9 |
8,1 |
||
|
Female |
||||||
|
18 – 25 |
2,8 |
6,1 |
10,3 |
14,3 |
||
|
26 – 30 |
1,4 |
3 |
5 |
7 |
||
|
31 – 40 |
1,1 |
2,4 |
4 |
5,6 |
||
|
41 – 60 |
1* |
2,2 |
3,7 |
5,1 |
||
|
> 60 |
0,9 |
2 |
3,4 |
4,7 |
||
Source: Adapted from Schade/Heinzmann (2004)
Given these obvious risk differences between groups of drivers, we may ask why this risk factor had not been selected in the German market after deregulation. The reasons are again institutional. This becomes apparent if we compare the key characteristics of the system of insurance in Canada to TPMI in Germany.
The Canadian DPS is part of a basic compulsory insurance that the federal states of Canada provide through a public monopoly insurer or, in some states, through private insurers that are fully regulated by public authorities. Moreover, the DPS is embedded into a dual system of driver and owner insurance. The concrete legal setting varies between the states. In Manitoba, for instance, drivers must be insured against all at-fault accidents. When renewing the driving license they have to take out state-owned basic insurance. Demerit points are used at this occasion to calculate a risk-based insurance rate.
Comparing this to the German TPMI, we find a much more competitive TPMI market and, more importantly, a unitary system of owner insurance. Driver’s in Germany are not legally accountable for accidents except for gross negligence where insurance is also denied. Applying a Canadian-style DPS within this system of unitary owner’s insurance would make the owner fully responsible for the driving of any user of his car. It would thus shift the principal-agent problem from the level of insurer and insureds to the level of owner and driver. This seems unreasonable (if both are not having the same identity) and is mentioned as a key obstacle to this scheme by the German insurance association [32]. The switching cost to a dual system of driver’s and owner’s insurance, on the other hand, would be substantial. It would require a system of dual accounting of accidents (for drivers and owners) at the Federal Transport Authority. As a result, we find that institutional givens prohibit the application of this potentially powerful risk determinant in Germany.
There are many good economic reasons for classifying insurance risks according to their type. It increases the efficiency of contracting, it improves the composition of insureds and it contains moral hazards. The benefits to society are less total damage and a lower average price of insurance. These multiple benefits of risk classification are however conditional on the market structure. They can be expected in ‘normal’ markets. In markets with remnants of a long history of regulation such as mandatory third-party motor insurance in Germany, they can be missed. The effects of risk classification in such markets are mainly re-distributive and potentially wasteful.
This paper studies the empirical effect of risk classification in the mandatory TPMI of Germany. It provides evidence that inefficient risk categories had been selected, while potentially efficient information was dismissed. We also find indications that the wave of risk classification in the 1990s did not improve the efficiency of contracting and the composition of insureds. Efficiency effects at the firm level were generally short-term and highly selective. Only firms who introduced valid risk determinants as first movers were able to decrease their loss ratio at the expense of other firms which did not immediately follow this behavior. But even this effect was temporary: the loss ratios reversed after a maximum of only two years. These findings are supported by general trends in the insurance market. The average price of car insurance did only temporarily decline and increased sharply in the late 1990s. Traffic-related damages did even increase in the aftermath of liberalisation. The disappointing showing of the new risk determinants can be partly explained by the existence of compulsory fixed coverage and other institutional restraints such as unitary owner insurance in this market.
Our findings have implications for the recent policy debate in the EU. They should caution us against a fierce economic critique of the EU initiative for gender equality: the costs of applying a restriction to use sex as a risk characteristic seems small in mandatory insurance markets such as German TPMI. This will be different in completely de-regulated markets (outside Germany). Missing a further cost-benefit analysis of this risk factor it seems recommendable to limit the directive’s field of application to mandatory branches of insurance in Europe.
References
Akerlof, G. (Akerlof 1970): The Market for "Lemons": Qualitative Uncertainty and the Market Mechanism, in: Quarterly Journal of Economics 1970,74, 494- 514.
Blackmon, B. G., Zeckhauser, R. (Blackmon/Zeckhauser 1991): Mis-priced Equity: Regulated Rates for Auto Insurance in Massachusetts, in: American Economic Review, Vol. 81 (2), Papers and Proceedings of the 103rd Annual Meeting of the AEA (May 1991), 65- 69.
Bond, E.W., Crocker, K. (Bond/Crocker 1991): Smoking, skydiving and knitting: the endogenous categorization of risk in insurance markets with asymmetric information, in: Journal of Political Economy 1991, 99, 177-200.
Boos, A. (Boos 1991), Effizienz von Bonus-Malus-Systemen, Wiesbaden, 1991.
Bund der Versicherten (BDV 2001): Elaboration of a Basis for Decisions of the EU Commission for a pan-European Structure in Third Party Motor Insurance Rating, 2001.
Buzzachi, L., Valetti, T.M. (2002): Strategic price discrimination in compulsory insurance markets, unpublished draft paper.
Bundesaufsichtsamt für das Versicherungswesen (BAV 1998): Geschäftsbericht des Bundesaufsichtsamtes für das Versicherungswesen, part A, Berlin (mimeo), 1998.
Chen, W., Cooper, P., Pinilli, M. (Chen et al.1995): Driver accident risk in relation to the penalty point system in British Columbia, in: Journal of Safety Research 1995, 26, 9- 18.
Crocker, K.J., Snow (Crocker/Snow 1986): The Efficiency Effects of Categorical Discrimination in the Insurance Industry, in: Journal of Political Economy 1986, 94 (2), 321- 344.
Crocker, K.J., Snow, A. (Crocker/Snow 2000): The theory of risk classification, in: Dionne, G. (ed.), Handbook of Insurance, Kluwer Academic Publisher, Dordrecht, 2000, 245-276.
Cummins, J.D., Tennyson, S. (Cummins/Tennyson 1992): Controlling Automobile Insurance Costs, in: Journal of Economic Perspectives 1992, 6 (2), 95- 115.
Diamantopoulou, K., Cameron, M., Dyle, D., Harrison, W. (Diamantopoulou 1997): The relationship between demerit points accrual and crash involvement, Report No. 116, Accident Research Centre, Monash University, Australia, 1997.
Ewers, H.-J., Growitsch, C., Schwarze, R., Schwintowski, H.-P., Wein, Th. (Ewers et al. 2004): Risikoorientierte Prämiendifferenzierung in der Kfz-Haftpflichtversicherung, Berichte der Bundesanstalt für Straßenwesen M 160, Bergisch-Gladbach, 2004.
Eisen, R. (Eisen 1976), Unsicherheit und Information, in: Jahrbücher für Nationalökonomie und Statistik (1976) 191 (3), 193-211.
Finanztest (Finanztest 1995): Rallye um Rabatte (3) 1995, 14-20.
Finanztest (Finanztest 1996): Verwirrspiel (3) 1996, 35-44.
Finanztest (Finanztest 1997): Zeit der Auslese (5) 1997, 72 – 79.
Finanztest (Finanztest 1999): Zeit für den Wechsel (10) 1999, 12- 19.
Finanztest (Finanztest 2000): Rabatt-Rallye (11) 2000, 82- 89.
Finanztest (Finanztest 2001): Zeit zu gehen (11) 2001, 12- 19.
Finanztest (Finanztest 2002): Teurer Anfang (11) 2002, 15- 21.
Finanztest (Finanztest 2003): Neues Spiel, neues Glück (12) 2003, 12- 21.
Gesamtverband der Deutschen Versicherungswirtschaft (GDV 2003): Statistisches Taschenbuch der Versicherungswirtschaft, Karlsruhe (Versicherungswirtschaft), 2003 (http://www.gdv.de/Hauptframe/index.jsp?navi=publikationen).
Harrington, H.I., Doerpinghaus, S.E. (Harrington/Doerpinghaus1993): The Economics and Politics of Automobile Insurance Rate Classification, in: Journal of Risk and Insurance 1993, 60 (1), 59- 84.
Hauer, E., Persaud, B. N., Smiley, A., Duncan, D. (Hauer et al. 1991): Estimating the Accident Potential of an Ontario Driver, in: Accident Analysis and Prevention, 1991, 23 (2- 3), 133- 152.
Hoy, M. (Hoy 1982): Categorizing Risks in the Insurance Industry, in: Quarterly Journal of Economics 1982, 97(2), 321-336.
Hoy, M. (Hoy 1984): The impact of imperfectly categorizing risks on income inequality and social welfare, in: Canadian Journal of Economics 1984, 17 (3), 557- 568.
Hoy, M. (Hoy 1988): Risk Management and the Value of Symmetric Information in Insurance Markets, in: Economics 1988, 55 (219), 355- 364.
Lemaire, J. (Lemaire 1995): Bonus-Malus-Systems in Automobile Insurance, Boston (Kluwer), 1995.
Muir, J.M. (Muir 1957): Principles and Practices in Connection with Classification Ratings Systems For Liability Insurance as applied to Private Passenger Automobiles, Proceedings of the Casualty Actuarial Society 1957, http://www.casact.org/pubs/proceed/proceed57/-57019.pdf.
Organisation for Economic Cooperation and Development (OECD 1990): Automobile insurance and road accident prevention, Paris, 1990.
Polborn, M.K. (Polborn 1997): Three Essays in Insurance, Inaugural Dissertation zur Erlangung des Grades Doctor oeconomicae publiciae (Dr. oec.publ.) an der Ludwig Maximilian University at Munich, unpublished, 1997.
Rea, S.A. (Rea 1992): Insurance Classifications and Social Welfare, in: Dionne, G., ed., Contributions to Insurance Economics, Boston-Kluwer Academic Publishers, 1992, 377-396.
Rothschild, M., Stiglitz, J. (Rothshild/Stiglitz 1976): Equilibrium in Competitive Insurance Markets - An Essay on the Economics of Imperfect Information, Quarterly Journal of Economics 1976, 90, 629- 649.
Smiley, A., Persaud, B., Duncan, D. (Smiley et al. 1990): Accidents, conviction and demerit points: An Ontario driver records study, in: Transportation Research Record, Bd. 1238, 1990, S. 53- 64. Washington, D.C.
Schade, F.D., Heinzmann, H.J.. (Schade/Heinzmann 2004): Risikogruppen im VZR als Basis für eine Prämiendifferenzierung in der Kfz-Haftpflicht, Berichte der Bundesanstalt für Straßenwesen M 159, 2004, Bergisch-Gladbach.
Schwintowski, H.P. (Schwintowski 2001): Fundamental principles of motor insurance, rating and the law of liability and damages in the European Union, Final Report for the Project Car Insurance Tariffs Part V, in: Bund der Versicherten (BDV) (2001), Elaboration of a Basis for Decisions of the EU Commission for a pan-European Structure in Third Party Motor Insurance Rating (http://www.bundderversicherten.de/Wissenschaft-/Car_Insur_Tarif-fs_E.htm ).
Statistisches Bundesamt (StatBA 2002): Statistisches Jahrbuch 2001 [Preisindex für die Lebenshaltung der privaten Haushalte, Sondergliederungen], Stuttgart (Kohlhammer).
Tillinghast Towers Perrin (2001): Eine Studie des deutschen Kfz-Versicherungsmarkets, Köln (unpublished data), 2001.
Wein, T. (Wein 2001): Wirkungen der Deregulierung auf den deutschen Versicherungsmarkt - Eine Zwischenbilanz, Karlsruhe (Verlag Versicherungswirtschaft), 2001.
Wilson, C.A. (Wilson 1977): A Model of Insurance Markets with Incomplete Information, in: Journal of Economic Theory 1977, 16, 167- 207.
[1] German Institute for Economic Research (DIW) Berlin, Koenigin-Luise-Strasse 4/ 5, D-14195 Berlin, email: rschwarze@diw.de , and European University Viadrina, Große Scharnstrasse 59, 15230 Frankfurt (Oder), email: schwarze@euv-frankfurt-o.de .
[2] University of Lueneburg, Institute for Economics, D-21332 Lueneburg, email: wein@uni-lueneburg.de
[3] cp. Muir 1957).
[4] cp. Blackmon/Zeckhauser (1991), Cummins/Tennyson (1992), and Harrington/Doerpinghaus (1993).
[5] Rating by nationality or race is since illegal in the UK, Germany, Luxembourg, the Netherlands and Sweden. The principle of non-discrimination is a constitutional right in many other countries, eg Austria, Finland and Spain. For details see Schwintowski (2001).
[6] Council directive is implementing the principle of equal treatment between women and men in the access to and supply of goods and services, COM (2003) 657 – C5‑0654/ 2003 – 2003/ 0265 (CNS). On 13 December 2004, the Council adopted this directive, permitting “proportionate differences in individuals' premiums and benefits where the use of sex is a determining factor in the assessment of risk based on relevant and accurate actuarial and statistical data.” Meanwhile all member states adopted this exemption which is to be reviewed five years after 21 December 2007.
[7] cp. Hoy (1982, 1988) Crocker/ Snow (1986, 2000).
[8] cp. Harrington/Doerpinghaus (1993)
[9] cp. Hoy (1984), 562.
[10] cp. Polborn (1997).
[11] cp. Buzzachi/Valetti (2002).
[12] Applying categories such as sex and age are often perceived ‘unfair’ because clients in such categories are treated as being average in their class, which also implies they can not adjust their behaviour to become better than average. From an actuarial point of view, however, it is not necessary that a risk characteristic applies equally to all policyholders of a group as long as the group of policyholders defined by the risk determinant differ significantly from other groups with respect to loss expectation.
[13] cp. Akerlof (1970).
[14] cp. Rothschild and Stiglitz (1976).
[15] eg Wilson (1977).
[16] cp. Rothschild and Stiglitz (1976), 638.
[17] cp. Hoy (1982, 1988), and Crocker and Snow (1986, 2000).
[18] An analogous illustration is provided in Rea (1992).
[19] Bonus-malus systems are applied in Belgium, Denmark, Finland, France, Germany, Italy and Sweden. Lemaire (1995) provides a comprehensive review and an excellent discussion of these systems.
[20] The apparent solution to avoid this incentive failure would be to connect the malus with the size of accident (cp. BOOS (1991) 86 f and Eisen (1976).
[21] cp. BAV (1998a) 57.
[22] cp. BDV (2001) 3.
[23] eg BDV (2001) 3.
[24] cp. Wein (2001).
[25] cp. Tillinghast Towers Perrin (2001).
[26] Data is taken from the GDV statistics (GDV, 2003) and the Statistical Yearbook of Germany.
[27] If the marginal cost to take care are lower for high-risk types than for low-risk-types, increased care by high-risks types is ceteris paribussocially more beneficial than decreased care of low-risks.
[28] cp. OECD (1990) 59-63.
[29] cp. Hauer et al. (1991), Smiley et al. (1990), Chen et al. (1995).
[30] cp. Diamontopolou et al. (1997).
[31] cp. Schade/Heinzelmann (2004).
[32] cp. Ewers et al. (2004).
Lizenz
Jedermann darf dieses Werk unter den Bedingungen der Digital Peer Publishing Lizenz elektronisch übermitteln und zum Download bereitstellen. Der Lizenztext ist im Internet abrufbar unter der Adresse http://www.dipp.nrw.de/lizenzen/dppl/dppl/DPPL_v2_de_06-2004.html
Zuletzt verändert: 2005-10-20 02:08 PM